- FirstStepFX Newsletter
- Posts
- What Makes a Great Trading Blog? Best Days to Trade Forex, Understanding Rate of Change (ROC) in Trading
What Makes a Great Trading Blog? Best Days to Trade Forex, Understanding Rate of Change (ROC) in Trading
Happy Sunday,
Welcome to this week’s edition! We’ve packed it with valuable insights to help you on your trading journey. This week, we’re diving into what makes a truly great trading blog so you can sharpen your learning resources. We’ll also break down the best days of the week to maximize your forex trading opportunities, and finally, we'll explore the Rate of Change (ROC) indicator and how it can help you spot shifts in market momentum. Let’s dive in and take your trading skills to the next level!
This week’s edition:
🧠 What Makes a Great Trading Blog?
📈 Best Days to Trade Forex
🚀 Understanding Rate of Change (ROC) in Trading
🧠 Psychology Insights: What Makes a Great Trading Blog?
With online trading platforms just a click away, anyone can jump into the markets today. But while placing trades is easy, becoming consistently profitable takes a lot more work and knowing where you get your trading information matters big time.
Many traders learn from books, mentors, and more often now, trading blogs. But with so many blogs out there, how do you find the good ones? Here’s a quick guide:
1. Look for a Solid Track Record
Trust blogs written by traders with real experience those who’ve survived bull markets, bear crashes, and economic bubbles. Also, be cautious of blogs focused more on selling courses or "magic systems" than teaching solid strategies. Real traders share real journeys not just flashy wins.
2. Useful, Actionable Information
A great blog gives you ideas you can use not just market gossip or endless memes. Whether it’s fresh technical analysis, trading plans, or breakdowns of economic news, you should walk away with something new for your toolkit.
3. Expands Your Thinking
Top-notch blogs don’t just tell you what to trade they show you how to think about trading. The best bloggers explain their process, offering insights into how they interpret market news, spot trends, and plan trades.
4. Encourages Discussion
The best blogs spark conversations. Some experienced traders love engaging with readers, answering questions, and even debating ideas, a goldmine if you want to learn faster.
📈 Educational Resources: Best Days to Trade Forex: A Simple Guide
Forex trading is open 24 hours a day, five days a week but not every day offers the same opportunities. Understanding which days have the most action can help you trade smarter and boost your chances of success.
When Are the Best Days to Trade?
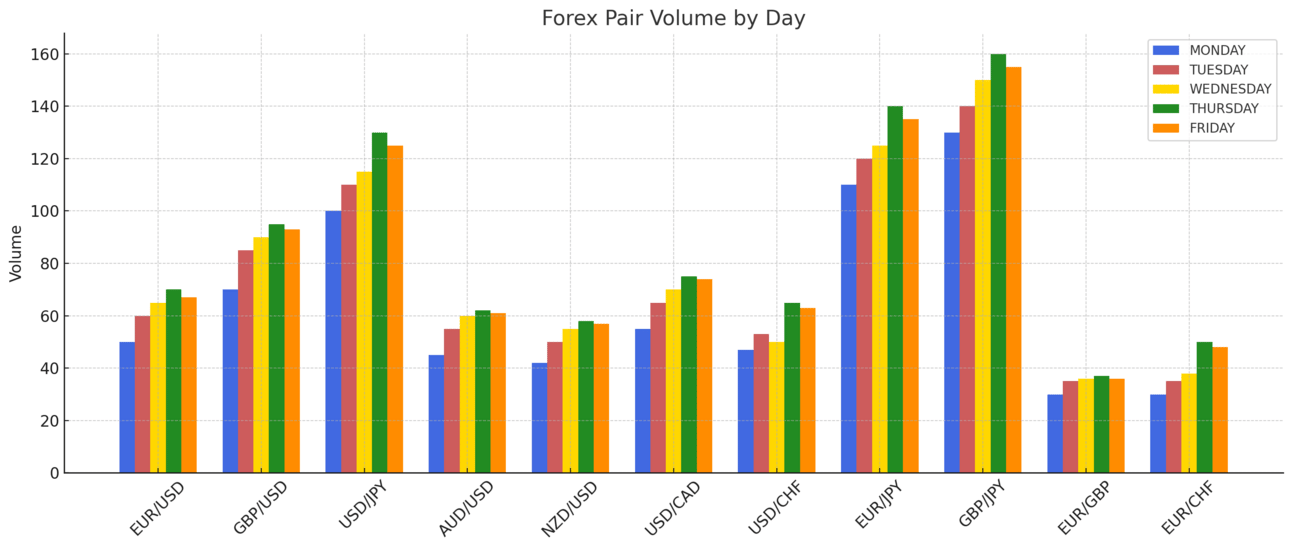
Midweek, especially Tuesday through Thursday, tends to have the highest volatility and bigger moves. Mondays are often slower as traders ease into the week, and Fridays slow down after noon (EST) as traders head into the weekend.
Average Pip Ranges by Day
Here’s a quick look:
Tuesday to Thursday: Best volatility and more trading opportunities.
Friday: Active until about noon, then the market goes quiet.
Monday: Generally slower; fewer big moves.
Pro Tip:
Focus your energy midweek when the markets are moving the most. Think of it like "prime time" for trading!

Manage Your Time Wisely
You can't (and shouldn’t) trade 24/5. Sleep, relax, and pick your spots! Trading smartly includes knowing when not to trade like slow Sundays, late Fridays, or during major holidays.
Quick Cheat Sheet: ✅ Best: When sessions overlap (London/New York), midweek, during major news events (if you’re ready!).
🚫 Worst: Sundays, late Fridays, holidays, emotional trading days.
Final Thought:
You don't need to be glued to the charts all week. Target the best days, manage your energy, and trade when conditions are in your favour!
🚀 Technical Indicator Spotlight: Understanding Rate of Change (ROC) in Trading
The Rate of Change (ROC) is a handy technical indicator that shows how fast a price is moving compared to its value from a few days ago. Think of it like a speedometer for price momentum!
ROC is often called a "momentum oscillator." It’s plotted below the price chart and moves above or below a zero line. When it’s above zero, prices are generally rising. When it’s below zero, prices are falling.
How ROC Works
Positive ROC: Price is climbing. If ROC is rising, buyers are getting stronger. If ROC is falling but still positive, the buying pressure is slowing down.
Negative ROC: Price is dropping. A steep dive means sellers are in control and prices are falling faster.

Trading with ROC
When ROC crosses above zero, it can signal a buy opportunity.
When ROC crosses below zero, it can signal a sell opportunity.
Just like other momentum indicators, ROC can stay in overbought or oversold zones for a while, so it’s important to use it with other tools or your trading plan.
Final Tip:
ROC is great for spotting shifts in momentum, but be cautious—markets can stay strong or weak longer than expected. Use ROC as a guide, not a crystal ball!