- FirstStepFX Newsletter
- Posts
- Trade at Your Own Risk, Understanding Forex Market Structure, RSI Made Simple
Trade at Your Own Risk, Understanding Forex Market Structure, RSI Made Simple
Happy Sunday,
Welcome to this week’s edition! We’ve packed it with valuable insights to help you on your trading journey. This week, we’re focusing on the foundation of smart trading. Learn how to assess your personal risk tolerance so you can trade with confidence, break down the structure of the massive and dynamic forex market, and master the RSI indicator to spot momentum and trend reversals with ease. Let’s dive in and take your trading skills to the next level!
This week’s edition:
🧠 Trade at Your Own Risk
📈 Understanding Forex Market Structure
🚀 RSI Made Simple
🧠 Psychology Insights: Trade at Your Own Risk (Tolerance)
Every trader asks at some point: “How much should I risk per trade?” You’ll often hear 1–2% of your account as the standard answer, while some aggressive traders may go up to 5%. But the real answer? It depends on you.
Risk tolerance is your comfort level with potential losses in pursuit of profits. If you have a steady income and experience in the markets, you might be more open to taking on risk. But if you're new, juggling bills, or emotionally reactive, smaller position sizes are likely your best bet.
Many beginners fall into the trap of risking too much, too soon. Chasing fast profits can lead to emotional decisions cutting trades too early or taking revenge trades after losses. It’s not about avoiding risk, but about matching your risk to your mindset and situation.
Here are some factors to consider:
✅ Lifestyle – If trading is your side gig, you may be more relaxed. But if it’s your only income, smaller, safer trades help reduce emotional stress.
✅ Account Size – Big accounts can handle more volatility. Small accounts need tighter risk control to avoid margin calls.
✅ Trading Style – Day traders may use slightly bigger positions due to shorter holding periods. Long-term traders typically use smaller positions to handle price swings.
✅ Experience – New traders should build skill with small risks. As your confidence and consistency grow, you can gradually increase your position sizes.
Start by risking 1% per trade. If you’re stressed, lower it. If you’re bored and disengaged, maybe increase it a little. There’s no one-size-fits-all. Know your limits, protect your capital, and adjust over time as your confidence grows.
Trade smart. Trade with a plan. And most importantly trade within your comfort zone.
📈 Educational Resources: Understanding Forex Market Structure: Who’s Who in the FX Game
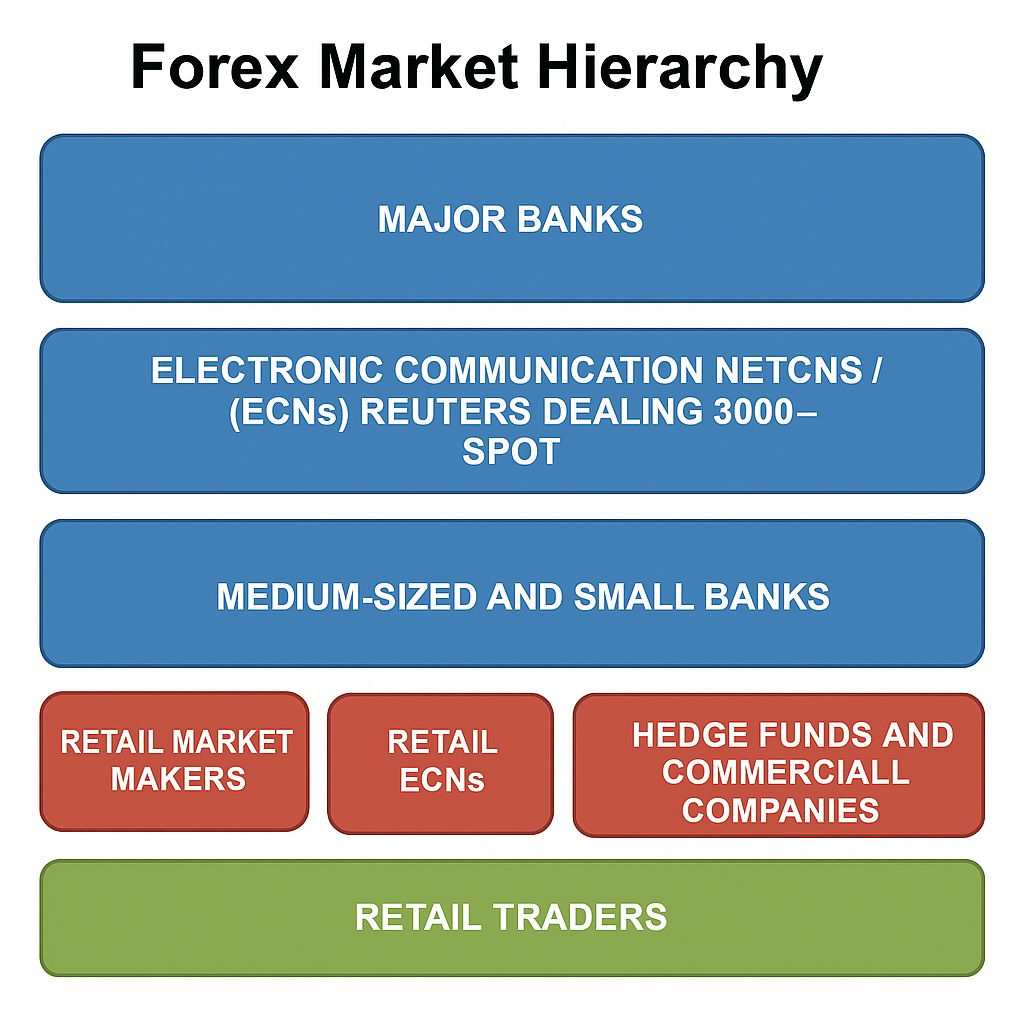
The foreign exchange (forex) market is the world’s largest financial market, with over $7 trillion traded daily. But unlike the stock market, it’s decentralized meaning there’s no single exchange or price. Instead, different participants quote their own prices, creating competition and better deals for traders.
Stock Market vs. Forex
Stock markets are centralized. Prices are often managed by a “specialist,” who can influence costs when there are too many buyers or sellers. In contrast, forex doesn’t run through a single authority, giving traders access to varying quotes and tighter spreads.
Forex: A Market Without Borders
In forex, trading happens 24/5 across the globe. Think of it like online shopping—you’re free to hunt for the best price. While it may sound chaotic, there’s actually a clear hierarchy behind the scenes.
The FX Ladder (From Top to Bottom) 🔝 Interbank Market – The big players: global banks trading huge volumes. They trade directly or through platforms like EBS Market and Refinitiv (formerly Reuters), where the most competitive prices are formed. 🏦 Next Tier – Hedge funds, corporations, and retail ECNs. These groups trade through larger banks and get decent (but slightly more expensive) rates. 👨💻 Retail Traders – That’s us! Individual traders enter the game through online brokers. While we’re at the bottom of the ladder, tech and leverage give us access to the same market—just with a longer stick. |  |
Final Thoughts
The forex market may seem vast, but it’s organized. Understanding where you stand in the structure helps you know what affects your trading conditions. Thanks to online platforms and tighter spreads, retail traders can now join the global currency game more easily than ever before.
🚀 Technical Indicator Spotlight: RSI Made Simple: Mastering Momentum in Forex
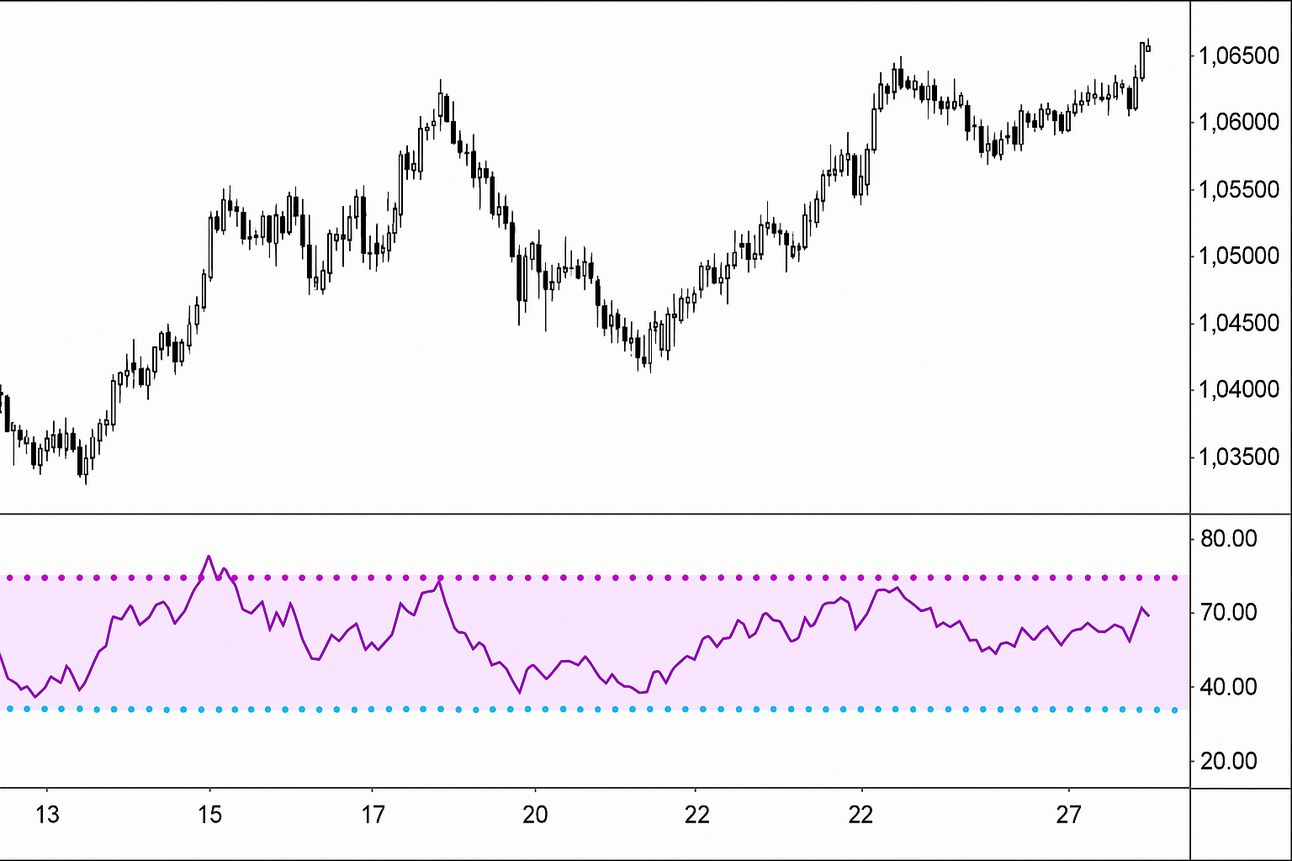
The Relative Strength Index (RSI) is a popular momentum indicator that helps traders measure how fast and strong price movements are. Developed by J. Welles Wilder Jr., RSI is a go-to tool for spotting trend strength, reversals, and overbought/oversold conditions.
🧠 What Is RSI?
RSI is shown as a line graph that moves between 0 and 100. It compares recent gains to losses over a set time (usually 14 periods) to show whether a currency pair is gaining or losing momentum.
Above 50 = bullish (prices rising)
Below 50 = bearish (prices falling)
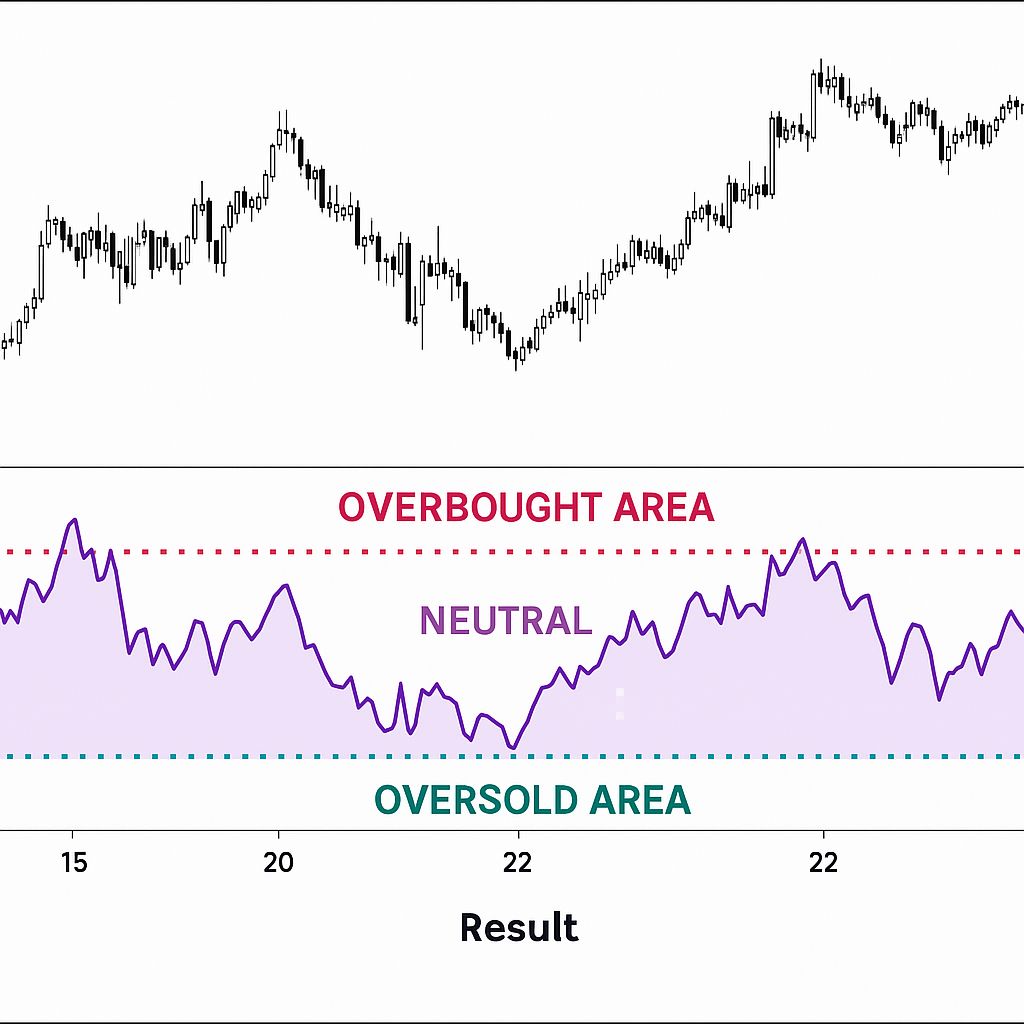
⚠️ Key RSI Zones
70–100: Overbought (price may fall soon)
30–0: Oversold (price may rise soon)
30–70: Neutral zone
In uptrends, RSI often stays between 40–90. In downtrends, it hovers between 10–60.

💡 How to Use RSI
1. Spot Reversals
Buy Signal: RSI falls below 30 (oversold) then rises back above.
Sell Signal: RSI rises above 70 (overbought) then drops below.

2. Confirm Trends
RSI crossing above 50 = bullish confirmation.
RSI dropping below 50 = bearish confirmation.
3. Watch for Divergence
Bullish Divergence: RSI makes a higher low while price makes a lower low (trend reversal upward).
Bearish Divergence: RSI makes a lower high while price makes a higher high (potential drop ahead).
Use RSI as a tool—not a crystal ball. Combine it with other indicators or chart patterns to make more confident trading decisions!